
By John Gross
Policy makers and the public both deserve meaningful measures of economic well being. Appropriate economic indicators of this type provide a snap shot of overall well being and indicate how economic conditions are changing, or how they may differ regionally.
PROUT discourages the use of per capita Gross National Product (GNP) or Gross Domestic Product (GDP) and similar measures for this purpose. Such measures never give a true picture of a population’s economic condition, but when there is pronounced inequality in distribution of income and wealth, such measures, can be extremely misleading. Median measures, which are not skewed by outliers as are mean scores (averages) are better but still fail to give a true picture of economic well being.
Rather than these, PROUT advocates the use of Purchasing Capacity, a measure of the ability to obtain the minimum necessities of life (food, clothing, housing, medical xanax care and education). In a future segment we consider specific Purchasing Capacity metrics and some specifics regarding how they might be computed and used. Here we look a bit at some of the concerns with the use of per capita and median income measures.
First, let’s be clear on terminology. A per capita measure is simply an average. It is the total divided by the population (or number of households if that’s our focus). So, per capita GDP is simply total GDP divided by Population.
The median is simply the middle point. The median is defined as the value where half the values are larger and half are smaller. If a distribution is symmetric the median and average are the same. When it is skewed (as is typical of distributions of income and wealth) median and per capita (average) measures can be quite different.
For example, when finding the average (mean, per capita) income of the following 5 incomes: $1,000,000, $50,000, $25,000, $15,000 and $5,000, the mean or per capita income is $219,000 while the median (middle value) is $25,000. If we want a picture of how most people are doing the median value comes closer. The $1,000,000 excessively influences the average so that it becomes meaningless as a measure of the midpoint of these incomes. The median comes closer, however, if we rely on the median measure of $25,000 we the circumstances of the family struggling to live on $5,000 aren’t caught. Any measure that only captures the center of a distribution tells us little about either extreme. When a distribution is highly skewed, averages (means/ per capita measures) will fall far from the middle, though when we hear “average” or even “per capita” we inherently think of the midpoint.
Below we show distributions of US household income for 2010 (green) and 2014 (purple)[1]
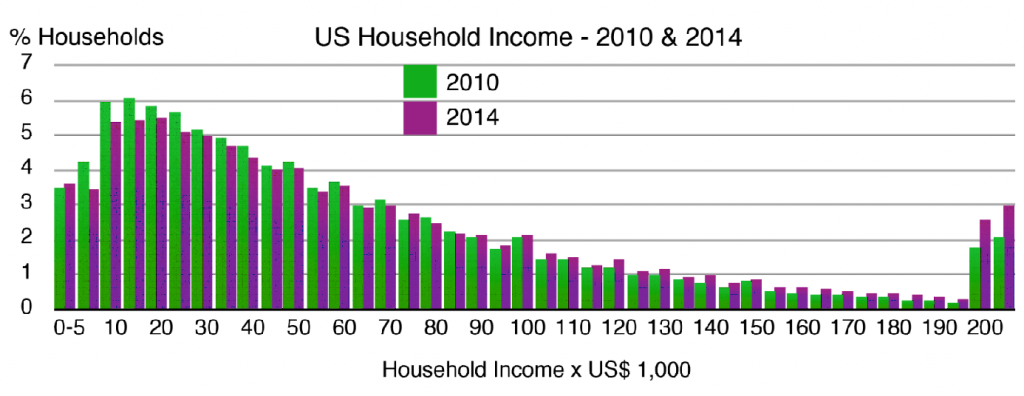
[1] http://www.census.gov/hhes/www/income/data/incpovhlth/2014/dtables.html
Median income in 2010 is just below $50,000 and in 2014 is slightly above. Per capita household income is much higher, about $69,000 in 2010 and over $75,000 in 2014. Per capita is considerably higher than median because there are a few households in the relatively small group over $250,000 annually that have extremely high incomes even a few that exceed a billion dollars each year. These extremely high earning households push up the average for the entire US.
Both a median income of around $50,000 and an average income of $70,000 suggest that US families are doing quite well. A closer look at the distribution of household income gives a different story.
Over 20% of households have annual incomes of $20,000 or less. An annual income for a household of four below $24,250 is considered poverty level. [2] The poverty level for a single individual is $11,770. The percentage of households below this level, almost 10%, is about the same as all households above $130,000.
Based on these statistics, over one in five of US tramadol families live in poverty and at least 10% live in severe poverty. This is sufficiently alarming for one of the wealthiest economies on the planet, but the reality is worse. Many of the lowest income households, those below $12,000 per year, are not individuals but a single parent (almost always a mother) with children. Even a family of four with an income around $25,000 per year, nominally just above the poverty line, in an urban area will, in actuality, live very poorly due to higher costs in such areas.
Most families with children with annual incomes below $30,000 are a single medical crisis or even simply a costly car repair away from a severe turn for the worse. Neither per capita nor median income measures can possibly reveal even the existence of poverty, let alone its nature or extent. Thus PROUT advocates the use of Purchasing Capacity, a measure of the ability to purchase life’s minimum necessities to capture how society and its members are faring.
Next time: Purchasing Capacity in detail.
[2] https://aspe.hhs.gov/2015-poverty-guidelines
Jagatbandhu (John Gross, Ph.D.) is an economist and long time Proutist living in central North Carolina. His interest in PROUT inspired him to obtain graduate training in economics.